During the third quarter of 2012, another 100,000 or so homeowners “reached a state of positive equity,” per the latest report from analytics firm CoreLogic.
That brought the three-quarter aggregate total to 1.4 million borrowers, thanks to higher home prices ushered on by extremely low inventory.
Still, there are millions more who are underwater on their mortgages, meaning they owe more than their properties are worth.
CoreLogic reported that 10.7 million homeowners were in a negative equity position as of the end of the third quarter.
That represented 22% of all residential properties with a mortgage, meaning we’ve got a ways to go before this housing crisis is really over.
Another 2.3 million borrowers were considered “near-negative equity” because they held less than five percent home equity at the end of the third quarter.
These types of borrowers may be above water, but if you factor in real estate commissions, they could still be forced to sell at a loss.
Together, these at-risk borrowers represented 26.8% of all mortgaged properties nationwide, down from 27% a quarter earlier.
In all, $31 billion in negative equity vanished from quarter-to-quarter.
Nevada Still Waterfront Property

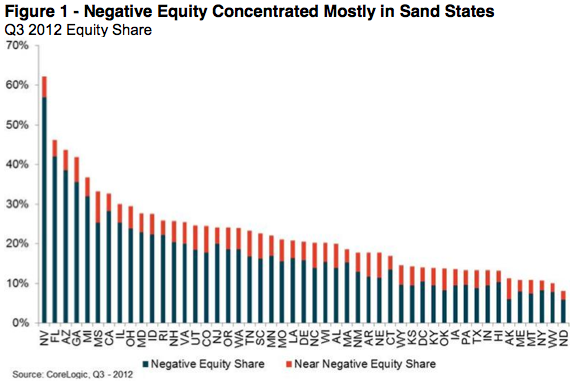
Despite being situated in a vast desert, Nevada continues to the lead the country in the underwater mortgage department.
In the Silver State, a whopping 56.9% of all mortgaged properties were still in a negative equity position as of the third quarter.
Nevada was followed by Florida (42.1%), Arizona (38.6%), Georgia (35.6%), and Michigan (32%).
These five states alone accounted for more than a third (34%) of the nation’s negative equity problem.
Across all 50 states, negative equity totaled $658 billion, with $323 billion of it coming from first liens with no home equity loans behind them.
That’s right – 6.6 million upside down borrowers don’t even have second mortgages, yet still managed to wind up underwater. That tells you just how badly overvalued real estate was at its peak.
For these borrowers, the average negative equity amount is $49,000.
Conversely, those that did take out home equity loans have an average negative equity amount of $82,000.
Sadly, much of the negative equity is concentrated in the lower end of the housing market.
For homes valued at less than $200,000, the negative equity share is 28.7%, nearly double the 14.6% for homes valued above $200,000.
21.7 Million Have HARP-Eligible LTVs
CoreLogic also noted that 17.1 million borrowers had qualifying loan-to-value ratios between 80% and 125%, which were the original LTV limits for HARP released back in 2009.
And with the lifting of the 125% LTV cap with HARP 2, another 4.6 million borrowers became eligible.
Hopefully these borrowers actually take advantage of the program available to them, though obviously not everyone will be enthused if they’re underwater by some overwhelming amount.
HARP has been gaining traction of late, thanks in part to the LTV limit removal, and it is estimated that just under two million borrowers have taken advantage.
It makes you wonder how many of these loans aren’t backed by Fannie Mae and Freddie Mac, and thus not eligible for HARP.
Assuming HARP 3 ever gains approval, it’s apparent that it could help a ton of distressed homeowners.
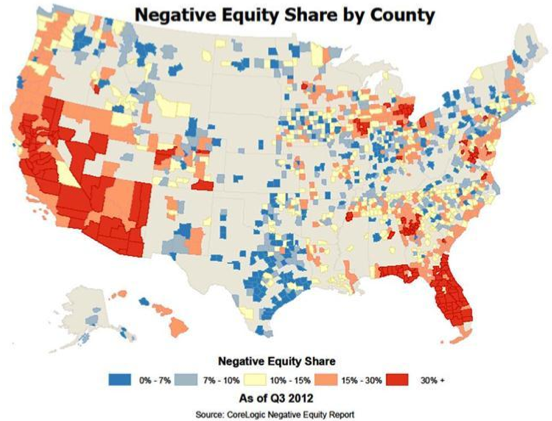
Take a look at negative equity by county, nationwide:


