
Recently, I wrote about when the next housing crash might take place. For opportunists, it’s something to look forward to.
For others, and frankly most people, it’s a disaster waiting to happen…though today’s mortgages are pretty boring and largely affordable, meaning homeowners should be able to ride the ups and downs a lot better than they did previously.
In that post, I spoke about an “18-year rhythm” that basically points to home prices peaking again around 2024. Of course, that’s the entire housing market.
As we all know, real estate is local…it doesn’t necessarily matter what’s going on in Florida if you live in California, or if the NYC condo market is overheated when you’re planning to buy in Chicago.
That brings me to this colorful and handy graph from John Burns Real Estate Consulting. It breaks down the housing cycle into five key phases, while also showing you which phase major markets are in at the moment.
Director of Research Rick Palacios Jr. breaks it down for us by looking at where the 20 largest new home volume markets stand at the moment. My assumption is we can judge existing homes in these markets somewhat similarly.
Start at the Bottom
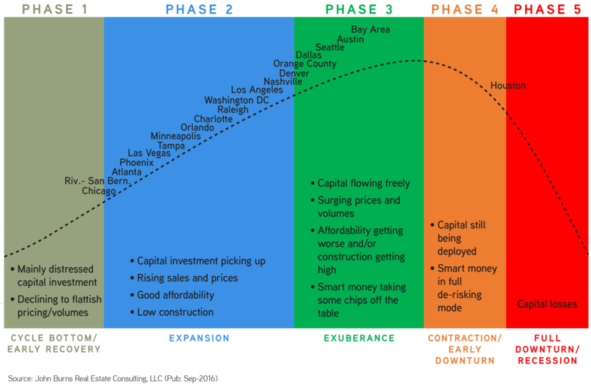
- Phase 1 is when home prices are bottoming and distressed inventory is king
- Phase 2 is when sales and prices begin to pick up with strong affordability
- Phase 3 sees a strong recovery and eroding affordability
- Phase 4 is your contraction period and Phase 5 is your full-blown crisis/recession
You’ve got phase 1, which is the housing bottom and early recovery stage. During this period, home prices are basically still declining and the market is dominated by distressed inventory.
We’ve seen this stage play out basically nationwide with the incredible number of short sales and foreclosures that hit the market over the past several years.
But it’s pretty much done now. In fact, the chart only shows one major metro that is part of it – Chicago. And they’re barely still in this stage (that’s assuming the chart placement is meaningful).
In the Second City (now third thanks to growing LA), home prices remain 23% below their recent peak and sales are off 85% thanks to ongoing economic woes.
There might still be tremendous upside there, but it could also be a value trap.
That takes us to phase 2, which is the expansion stage. This is when both home sales and home prices increase, and when new home construction is still low. Affordability remains high and capital investment increases.
There are many major cities still in this early phase, according to Palacios Jr. There are almost too many to count, but some of the bigger markets include Atlanta, Las Vegas, Los Angeles, Orlando, Phoenix, Tampa, and Washington DC.
In these areas, investment risk remains low because home “prices have yet to rebound massively, with home values roughly 20%–30% below prior peak” levels. Of course, it really depends where it is…some have increased far more.
Still, these cities are enjoying job growth and reasonable affordability, so they’re good places to buy assuming you can find a home.
Irrational Exuberance
- When things start to get a little too exuberant
- With bidding wars and buyers paying way over asking
- It might be time to give pause
- And crunch the numbers to see if buying a home still make sense
They do point out that Denver, Nashville, and Orange County are riskier and nearly in the next phase, known as Exuberance.
In this third phase, things get a little more cautious if you’re a prudent investor. After several years of good times, it’s time to pump the brakes a little and reassess.
The so-called “smart money” knows this, but the common home buyer probably doesn’t. That might explain why home prices continue to rise even when seemingly overextended.
Places like Austin, the Bay Area (in Northern California), Dallas, and Seattle apparently fit this description.
While these cities have been on a tear lately, affordability is beginning to become a major problem. Enter loan programs like the POPPYLOAN for hopeful San Francisco home buyers. And numerous zero down and near-zero down options.
It’s not quite 2006 yet, but there are similar ominous signs such as people moving to nearby cities and suburbs (perhaps driving to qualify) and still paying a pretty penny for not-so-ideal homes.
The Downturn and Eventual Recession
- At this stage it’s pretty apparent that things aren’t going well
- But what might be unclear is how bad it will get
- Like recoveries, downturns can take longer than anticipated to play out
- So it might be wise to stay on the sidelines and wait for the true bottom to hit
That brings us to phase 4, known as the contraction/early downturn period. Only one metro is in this latter stage, and it’s really only there because of an issue outside the housing market’s control.
It has to do with oil, which most know plummeted in price per barrel over the past few years. That has hammered the oil-rich industry in Houston, causing construction to slow while putting pressure on higher-priced homes.
The lower-priced homes in the city have held up though, which is a good sign. The brains at John Burns don’t think Houston will fall into the dreaded phase 5, or full downturn/recession stage. But they do expect it to remain in the purgatory of phase 4 through 2017.
As expected, none of the top 20 housing markets are in phase 5, and that’s really no surprise because it’s only been three of four years since we hit rock bottom.
I suppose that means you’ve got the greenlight to buy a home, but you do have to be a bit more mindful these days. The bargains are pretty much gone and prices do seem to be getting ahead of themselves in many areas.
A low mortgage rate is great, but not when you’ve overpaid for a home near its new peak price.