

While the housing market has been coming up roses lately, even in the face of COVID-19, it might turn out to be a short-lived affair as widespread unemployment takes hold.
A new report from CoreLogic today revealed that despite a strong showing in May compared to a year earlier, home prices are actually slated to fall by 2021.
This would mark the first national decline in nearly a decade, which could signal a top in home prices after many years of stellar gains.
First Annual Home Price Decrease in Over 9 Years
- While home prices rose 4.8% year-over-year in May
- They are expected to fall 6.6% from May 2020 to May 2021
- Would be the first annual decrease in more than nine years
- Could signal the end of a very long recovery for home prices
Nationally, home prices were up 4.8% year-over-year in May, per the latest CoreLogic Home Price Index (HPI) Report.
For perspective, the May 2020 HPI gain from May 2019 was only 3.6%, so home price growth accelerated and defied many expectations that anticipated the opposite.
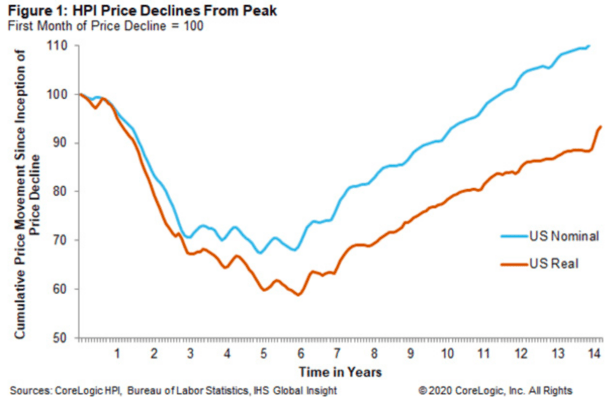
We’ve certainly had a good run, with the HPI increasing every month since February 2012 on a year-over-year basis, chalking a massive 68.3% gain after bottoming in March 2011.
However, when you look at the increase in real terms adjusted for inflation, home prices are still 6.7% below their 2006 peak in May.
As you can see from the image above, home prices haven’t truly recovered from their 2006 highs, not that prices at that time were based on anything close to resembling reality.
While that tells me we still have some legs in this rally, the negative effects of COVID-19 might create a temporary setback, at minimum.
Whether it creates a meaningful end to the run-up in home prices over the past decade is another question entirely.
Low-Priced Homes Saw the Biggest Gains
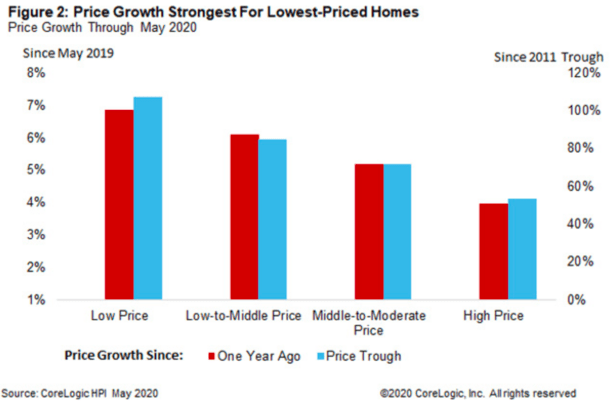
CoreLogic further broke down the home price gains by individual home-price tier to see how they performed relative to one another.
The tiers were based on the median sale price:
Low price – homes priced at 75% or less of the median
Low-to-middle price – homes priced between 75% and 100% of the median
Middle-to-moderate price – homes priced between 100% and 125% of the median
High price – homes priced greater than 125% of the median
It turns out the lowest price tier increased the most, rising 6.9% year-over-year in May 2020, and 107.5% since bottoming in 2011.
The low-to-middle-price tier notched a 6.1% gain in May 2020 and an 85% gain since the housing bottom.
Meanwhile, home prices were up just 5.2% for the middle-to-moderate tier (71.8% since 2011) and 4% for the high price tier (53.7% since 2011).
The good news for all existing homeowners is that home price growth accelerated in all four pricing tiers this year.
But if you’re looking for the biggest percentage gains, sometimes the entry-level homes are the best bet, especially with the millions of first-time home buyers entering the market.
In terms of current value of housing stock, 39% of metropolitan areas were overvalued, 24% were undervalued, and 37% were at value.
Again, you need to consider your own local housing market as opposed to solely following the national numbers.
For example, already overvalued Las Vegas home prices are forecast to plummet by 20.1% over the next year.
You can thank COVID-19 for that, which is obliterating the economy that is mostly driven by tourism.
Conversely, home prices in San Diego, which are presently considered “normal,” are only expected to dip 1.3% over the next 12 months.
In other words, know your housing market.