
Lately, there’s been a lot of talk about a lack of affordability, even a potential housing bubble.
And it comes as no surprise, given the massive shock of a near-tripling of mortgage rates over just a year and a half.
The 30-year fixed could be had in the low 3s, maybe even high 2s back in early 2022, and today is closer to 7%.
At the same time, home prices haven’t come down, despite a slowing rate of appreciation.
Together, this has brought the housing market to its knees and pushed many prospective buyers onto the sidelines. But those who sell are still reaping massive profits.
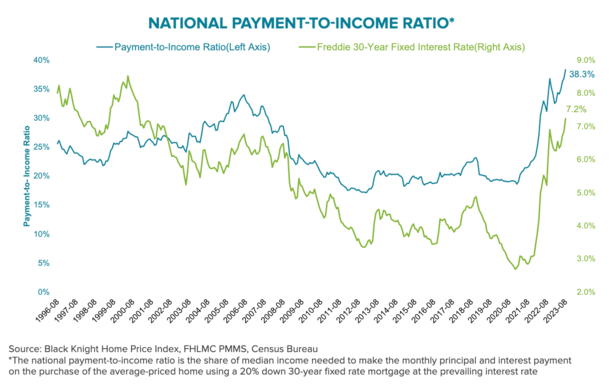
Home Buying Is the Least Affordable Since 1984
Remember those 1980s mortgage rates that were in the double-digits? Well, today’s mortgage rates are nowhere close.
However, due to sky-high home prices and elevated interest rates, home buying is the least affordable it has been since 1984.
That’s right, it hasn’t been this bad in about 40 years, which illustrates just how challenging this housing market has become.
Per Black Knight, it now requires 38.3% of the median household income to make a monthly mortgage payment on an average-priced home.
Using Freddie Mac’s 7.23% average for a conforming 30-year fixed mortgage as of August 24th, the monthly principal and interest payment climbed to $2,423.
And this assumes the buyer comes in with a 20% down payment, when in reality many borrowers can only muster 3-5%.
To the point of it being a bubble, it would take some heavy lifting to bring affordability back to its 25-year average.
We’re talking some combination of a ~27% decline in home prices, a 4%+ reduction in 30-year mortgage rates, or a whopping 60% increase in median household.
Which of those three do you think are likeliest to transpire? Probably none of them barring another massive housing crash.
But a combination of the first two is reasonable, whether it’s a 10% drop in home prices and a 2% drop in mortgage rates. Or some other combination.
It’s unclear if wages are going to see much improvement from here on out, certainly nowhere close to 60%.
For perspective, the 30-year fixed averaged about 13.2% the last time housing affordability was this bad.
This tells you home price growth has far outpaced wage growth, essentially demanding low interest rates bridge the gap.
Despite this, home sellers are racking up massive gains, thanks to double-digit home price appreciation over the past several years.
The Few Home Sellers Out There Are Raking in Big Profits
Redfin reported today that 97% of home sellers sold for a profit during the three months ending July 31st.
And the typical property that sold went for a whopping 78.4% more than the seller paid, or $203,232.
While there is a severe lack of affordability in today’s housing market, there seems to be an even bigger shortage of homes to purchase.
As such, home prices remain on the up and up, allowing the few sellers out there to take in a tidy profit.
The majority of sellers purchased their homes well before property values skyrocketed, making it pretty easy to snag a six-figure gain.
San Jose leads the nation in median capital gain at a staggering $755,000. It’s also 108.6% higher than what the seller paid.
San Francisco isn’t far behind at $625,500 and 70.5%, respectively, followed by Anaheim at $470,000 and 88.7%.
Even Detroit, which ranked last in terms of dollar gains of the 50 metros analyzed saw a median $80,500 capital gain.
If we consider percentage gains, Fort Lauderdale topped the list with a 122.2% cap gain, followed by San Jose and Miami.
Some Home Sellers Are Losing Money, Especially in San Francisco
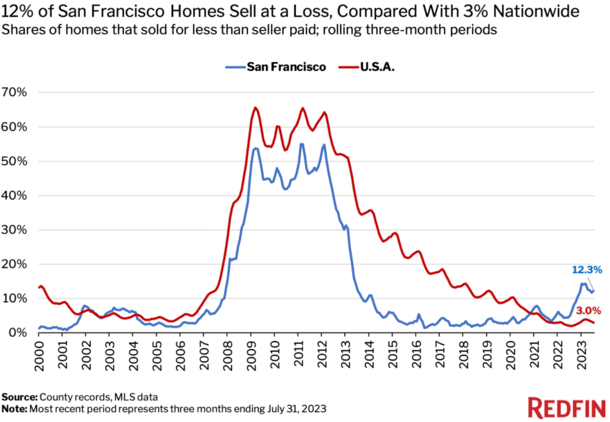
While most sellers are making out like bandits, Redfin did note that some home sellers are parting with their properties at a loss.
This is especially true in San Francisco, which has struggled with falling property values and tech layoffs.
San Francisco’s median home sale price fell a record 13.3% year-over-year from April 2022 to April 2023, more than triple the nationwide decline of 4.2% at that time.
But as of July, prices were down just 4.3% year-over-year, somewhat closer to the national gain of 1.6%.
This might explain why 12% of home sellers in San Francisco sold for a loss during the three months ending July 31st.
Put another way, one of every eight homes that sold during this period went for less than what the seller paid.
And the typical seller sold for about $100,000 less than what they paid, tying New York for the largest median loss in dollars.
Nationwide, the typical homeowner who sold for a loss only sold for $35,538 less than what they paid.
Other major metros that had a high percentage of sellers taking a loss included Detroit (6.9%), Chicago (6.5%), New York (5.9%), and Cleveland (5.8%).
One Redfin Premier agent said some condos in the Bay Area are selling below 2018/2019 purchase prices because commuting into downtown San Francisco is no longer “a thing anymore.”
Meanwhile, an agent in Boise said some clients will need to sell at a $100,000 loss as they move back to Seattle because work-from-home (WFH) has ended and they bought the properties recently.
But the price point on such transactions is generally above $750,000, which probably isn’t your typical home in that part of Idaho.
And as you can see from the chart above, very few homes are selling for below what the seller originally paid.
So before we get excited about another short sale wave, as seen in the early 2000s, we may want to temper our expectations.
Of course, market conditions can change fast. For example, a year ago only 0.2% of Austin homes sold at a loss versus 3% in the same period this year.
Austin had the lowest share of home sales at a loss of the top 50 metros. Not so anymore.