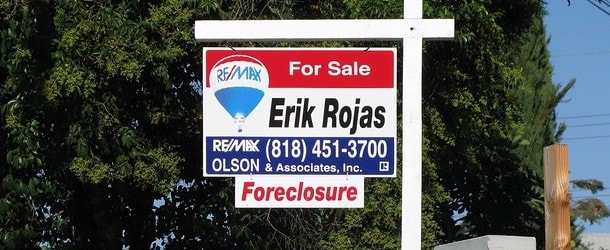
Skip to content

Foreclosures Up as Housing Prices Post Record Fall

upndown

Foreclosure activity increased 23 percent in the first quarter compared to the previous quarter and was up 112 percent from a year ago, RealtyTrac said today.

Foreclosure filings were reported on 649,917 properties, or one in every 194 U.S. households, during the quarter.

RealtyTrac chief James J. Saccacio said foreclosure activity increased in 46 out of the 50 states and in 90 of the 100 largest metro in the nation areas during the first quarter.

Although he did note that some areas saw a decease in foreclosure activity due to non-market factors, such as the city of Philadelphia, because of their temporary foreclosure moratorium on owner-occupied properties.

However, he was quick to point out that the action to freeze foreclosures would likely just delay the inevitable and lengthen the time until recovery.

Nevada, California, and Arizona posted the highest foreclosure rates, while California led the nation in the total number of filings with 169,831.

Foreclosure activity in the Golden State was up 32 percent from the fourth quarter and nearly 213 percent from a year ago.

California and Florida metro areas accounted for 13 of the top 20 metro foreclosure rates, with Stockton and Riverside-San Bernardino taking the top two spots.

Philadelphia’s foreclosure rate ranked 82nd, thanks in part to a 30 percent annual decline in foreclosure activity.

Home Prices Continue Slide

Meanwhile, the February S&P/Case Shiller 20-city home price index fell 12.7 percent from a year ago, and was off 2.6 percent from January.

The 10-city composite index posted a record-low annual decline of 13.6 percent and a month-to-month drop of 2.8 percent.

“There is no sign of a bottom in the numbers,” says David M. Blitzer, Chairman of the Index Committee at Standard & Poor’s. “Prices of single family homes continue to drop across the nation. All 20 metro areas were in the red for the February-over-January reading. In addition, 19 of the 20 MSAs are still reporting negative annual returns.”

“The monthly data show that every one of the MSAs has now declined every month since September 2007, marking six consecutive months. On top of that, the declines have remained steep with eight of the 20 MSAs and both composites reporting their single largest monthly decline in February.”

(photo: noys)

Leave a Reply

Your email address will not be published. Required fields are marked *