While it’s becoming easier to compare the housing bust that sparked the Great Recession with today’s uncertain climate, the two just aren’t the same.
You’re probably going to see lots of articles warning of the next housing crash, claiming homeowners will be unable to pay their mortgages and forced to sell due to COVID-19.
But those opinions may ignore a lot of real statistics that paint an entirely different picture.
I used actual numbers from the latest Black Knight Mortgage Monitor report for February 2020 to illustrate.
Greater Share of Homeowners with 10% or More in Equity

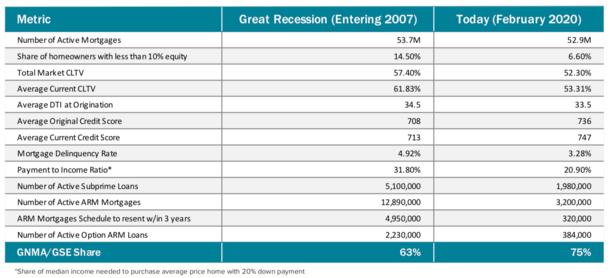
First off, today’s homeowners are flush with home equity. In 2007, 14.5% of homeowners had 10% or less in equity. Today, just 6.6% have less than 10% equity.
This is due to several years of strong appreciation coupled with deleveraging.
In other words, not tapping equity via a HELOC or a cash out refinance, while also paying down debt via regular principal and interest payments.
During the early 2000s, homeowners were serially refinancing their homes while also making interest-only payments.
This meant they were overleveraging themselves and often getting into loans they couldn’t actually afford due to lax underwriting standards.
Loan-to-Value Ratios (LTVs) Are Lower Today
To that same point, today’s loan-to-value ratios (LTVs) are a lot lower than they were a decade or so ago thanks to more prudent underwriting guidelines.
The total market combined LTV (CLTV), which includes second mortgages, was 57.4% in 2007, and just 52.3% today.
The average CLTV was 61.83% back then, and just 53.31% today. Again, this shows many homeowners have lots of equity, as opposed to a massive mortgage on an overpriced property.
Simply put, equity means options, and vice versa. Even if borrowers struggle to make mortgage payments, the equity cushion provides better exits like a normal home sale as opposed to a short sale.
It also disincentivizes things like strategic default, where homeowners voluntarily walk away from their “worthless homes.”
Average DTI Ratios Are Also Lower
In terms of borrower capacity to repay, debt-to-income ratios (DTIs) are also lower today than they were in 2007.
While the average DTI at origination was 34.5% back then, it’s currently 33.5%. You might say it’s not much different.
But consider this – how many loans were actually properly underwritten back then? How many were stated income, effectively making the DTI measure useless?
The answer is most loans relied on stated income back then, while today’s DTI ratios are driven by real tax returns, pay stubs, and so on.
Borrower Credit Scores Are Higher, Delinquency Rate Lower
Then we’ve got credit, which is also better than it was leading into the Great Recession.
In 2007, the average original credit score was 708, compared to 736 today. And the average current credit score is 713, much lower than the 747 today.
While credit score isn’t everything, combined with more homeowner equity and better quality mortgages means lower defaults.
And we’re seeing that, with the mortgage delinquency rate 4.92% in 2007 compared to 3.28% today.
Again, you can thank properly underwritten mortgages for that, and a homeowner’s desire to protect the equity they’ve accrued.
Payment-to-Income Ratios Are Much Lower
Part of it just has to do with affordability, or the payment-to-income ratio.
It’s “a measure of how well home prices are supported by current incomes and interest rates,” and is much stronger than in years past.
In 2007 it stood at 31.8%, and today just 20.9%, a testament to how affordable homes are despite prices being nominally high.
Remember, you have to factor in inflation between now and then, along with higher wages, lower mortgage rates, and so on.
While the home may cost more than it did at the subprime peak, it’s actually cheaper for the reasons mentioned.
And again, a borrower’s income is actually verified today, as opposed to them simply stating that they made X amount per month.
Much Less Subprime Lending Today
While credit profiles are mostly better today than they were, subprime lending still exists today.
In the mortgage industry, it’s defined as a sub-620 FICO score, which is all you need to get an FHA loan or a VA loan.
However, the number of active subprime loans in 2007 was a whopping 5.1 million. Today, it’s less than two million.
To make matters better, these homeowners generally have more equity and a boring old 30-year fixed as opposed to some exotic mortgage.
Fewer Adjustable-Rate Mortgages and Option ARMs
Speaking of mortgage product, the number of active adjustable-rate mortgages is nowhere close to what it was in 2007.
Entering the Great Recession, there were a staggering 12,890,000 ARMs in circulation. Today, just 3.2 million.
Additionally, 4.95 million of those 2007 ARMs were scheduled to reset (higher) within three years.
Just 320,000 of today’s ARMs are scheduled to reset in three years. These borrowers also have fantastic options to refinance to a lower or comparable fixed-rate mortgage.
Then there were the option ARMs, which numbered 2,230,000 in 2007. Those are/were truly toxic mortgages that total just 320,000 today.
So to summarize, today’s homeowners have more equity, higher FICO scores, lower DTI ratios, properly-underwritten loans, and mostly fixed-rate mortgages with interest rates at/near record lows.
Throw in the fact that housing inventory is at its lowest point in years and it’s hard to compare then to now, even with COVID-19 beginning to make us question everything.
- Will Mortgage Rates Be Higher or Lower by the End of 2025? I Asked AI. - July 2, 2025
- Rocket Mortgage Completes Redfin Takeover, Offers $6,000 Home Buyer Credit - July 1, 2025
- Mortgage Rates Quietly Fall to Lows of 2025 - June 30, 2025

