Let’s talk mortgage basics. There are two main types of mortgage refinances available to homeowners.
There is the standard rate and term refinance, which allows a borrower to obtain a lower mortgage rate and/or shorten their loan term, while keeping their existing loan balance intact.
And then there is the “cash-out refinance,” which allows a borrower to tap into the equity (or cash) in their home.
Cash Out Refinance 101: Key Takeaways
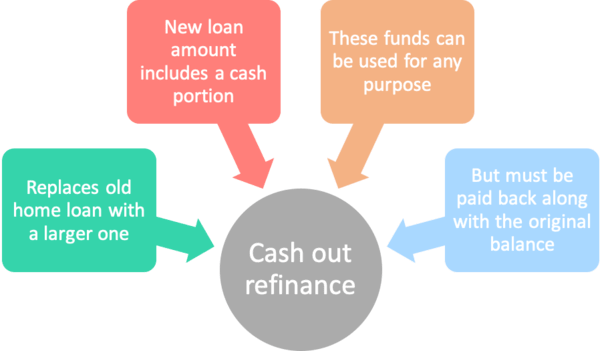
Definition: A cash-out refinance is a mortgage transaction where you borrow more than your current loan balance and receive the proceeds in cash for purposes such as home improvements, debt consolidation, or other expenses.
How it works: Replaces your existing mortgage with a larger loan, paying off the outstanding balance and leaving you with the difference in cash, minus closing costs.
Larger mortgage balance: The new loan will be larger than the original one, often leading to higher monthly payments unless you can secure a lower interest rate and/or extend the loan term.
Equity required: You need sufficient home equity (typically at least 20% after the refinance) to qualify for a cash-out refinance, as lenders cap the loan-to-value (LTV) ratio at 80% for conforming loans.
Potential benefits: Provides a lump sum of cash at a low interest rate (relative to other options), and if rates drop in the process, you could lower your mortgage interest rate too, making it a “home run.”
Flexibility of funds: Cash can be used for anything, including home renovations, college tuition, paying off other high-interest debt, or even investments without restrictions.
Single loan option: Unlike a second mortgage (e.g. HELOC or home equity loan), a cash-out refinance consolidates everything into a single loan with one monthly payment.
Rate impact: Cash-out refinance rates are typically higher than rate and term refinance rates (e.g. 7% vs. 6.5%), reflecting added risk for banks/lenders.
Potential downsides: A larger loan at a higher rate can significantly increase your monthly payment and total interest paid over time, as well as restart the clock on mortgage payoff.
Credit score and LTV considerations: Poor credit and/or a high LTV ratio can lead to even higher interest rates, making the refinance less appealing.
Debt consolidation use: Some homeowners use it to pay off credit cards or other debts at closing, but this rolls short-term debt into a long-term mortgage, potentially extending repayment over decades.
Alternatives: A HELOC or home equity loan might be better if you want to keep your existing low-rate first mortgage intact since you probably want to keep your 2-4% mortgage for the long-haul.
Rates matter: With current mortgage rates around 7%, replacing a low-rate mortgage (e.g. 3%) with a much higher one might not make sense unless you urgently need cash.
Timing: It’s most advantageous when mortgage rates are low, allowing you to refinance the entire loan at a better rate while also accessing equity.
Jump to cash-out refinance topics:
– How Does a Cash-Out Refinance Work?
– Should I Take Cash Out?
– Cash-Out Refinance Examples
– Reasons to Pull Cash Out?
– Cash-Out Refinance Rates
– How Much Can I Cash Out?
– Debt Consolidation Loan vs. Cash-Out Refinance
– Pros and Cons of a Cash-Out Refinance
– Cash-Out Refinance FAQ
– Cash-Out Refinance Tax Implications
How Does a Cash-Out Refinance Work?
- It works like a typical mortgage refinance in that you replace your existing home loan(s) with a new one
- But the loan balance will be larger thanks to the additional cash out portion requested
- This cash is extracted from your available home equity (difference between loan balance and property value)
- And can then be used for whatever purpose you choose such as to pay off other loans or renovate your home
If you’ve paid down your current mortgage balance and/or home prices have increased since purchase, you may have equity in your home that you can access via cashout refinancing.
Once accessed, this cash can be deposited into your bank account and used for other expenses, such as funding home improvements, paying for college tuition, or paying off more expensive credit cards.
With today’s mortgage rates so attractive, it might be possible to refinance your mortgage, get cash out, and obtain a lower interest rate, all in one transaction.
This might be especially true if the value of your home has increased significantly since you took out your original mortgage.
Let’s learn more about what a cashout refi is, the pros and cons, and how this loan option can quickly replenish your savings account to pay for other bills.
Do You Want Cash Out with That?
- If you apply for a mortgage refinance you will probably be asked if you want cash out
- This helps the lender determine what type of refinance you want/need
- And if so, how much you would like (they’ll tell you the max you can pull out)
- It’s totally optional and any cash you take must be paid back along with the original loan balance
When mortgage refinancing, if a borrower elects to take “cash out” in addition to changing the rate and term of their existing home loan, the new mortgage balance will be larger than the original.
That’s right, these funds don’t appear out of thin air, nor is it free money, even though you get cash in hand (or bank account)!
I kind of liken this to the old line, “Do you want fries with that?” But instead it’s, “Do you want cash out with your home refinance?”
In short, you’re taking out a larger loan when you execute a cash out refinance, which means monthly payments will likely be higher.
You can use my mortgage payment calculator to see how much more you’ll pay each month.
Once the refinance loan is complete, the new loan will consist of the original balance prior to the refinance plus the desired cash out amount, less closing costs.
So expect both the size of your mortgage and your mortgage payment (depending on interest rates) to increase in return for a cold, hard lump sum of cash.
As noted, if you are able to snag a lower interest rate and get cash from your home, you’ve hit a home run! You’re saving money and you’ve got money in the bank.
Get a Cash Out Refinance or Open a Line of Credit (HELOC)?
- You may have the option to refinance your existing mortgage and pull out cash
- Or simply open a second mortgage behind it such as a HELOC or home equity loan
- This could make sense if you like the rate on your first mortgage and don’t want to mess with it
- You’ll also avoid restarting your loan term and slowing down your loan repayment
If you’ve got ample equity in your home, you’ve got multiple refinance options at your disposal, along with another loan type that won’t disrupt your loan term and payoff goals.
There are essentially two main ways a borrower can tap into their home equity.
They can either open up a home equity loan or home equity line of credit, also known as a HELOC, behind their existing first mortgage, or refinance their current mortgage(s) and take cash out in the process.
Some Cash Out Refinance Examples to Help Illustrate
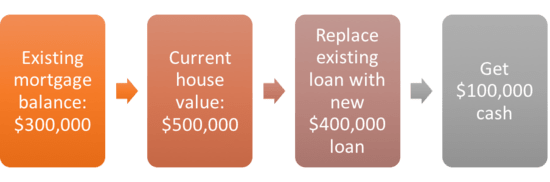
Let’s look at an example where a homeowner wishes to get $100,000 cash out of their home:
Home value: $500,000
Existing liens: $300,000 (fancy way of saying current loan balance)
Home equity: $200,000
In the above example, the homeowner has an existing mortgage balance of $300,000. The home has a current market value of $500,000, so the homeowner has $200,000 in home equity. In other words, the homeowner essentially owns $200,000 of their home, or 40% of the current property value.
As mentioned, if the homeowner wishes to tap into that equity, they can either get a second mortgage (HELOC or home equity loan) or execute a cash-out refinance.
Let’s assume the homeowner opts to add a second mortgage via a HELOC:
Home value: $500,000
Existing liens: $300,000
HELOC: $100,000 (behind the 1st mortgage)
Home equity: $100,000
In the above example, the homeowner adds a second mortgage behind their existing $300,000 first mortgage. The $100,000 home equity line they added increases their existing loan balance to $400,000, and subsequently lowers the equity in their home to $100,000.
But the homeowner now has a $100,000 credit line (tied to the prime rate) to use for whatever they wish, without changing the rate or term of the current loan. This is NOT a cash-out refinance.
Now let’s assume they execute a cash-out refinance by refinancing their existing loan and adding cash out:
Home value: $500,000
Existing liens: $300,000
Cash-out refinance: $400,000 ($400,000 new 1st mortgage, no 2nd mortgage, $100k cash goes to borrower)
Home equity: $100,000
In this example, the homeowner refinances their original $300,000 mortgage and takes an additional $100,000 cash out, creating a new $400,000 mortgage.
The amount of equity and cash to the borrower are the same in this scenario as in the first example.
The only difference is that the homeowner still has a single home loan, as opposed to two mortgage loans, although it’s a completely new mortgage with a brand new term and possibly a new interest rate, quite likely with a different bank or mortgage lender.
So which approach works best? There are pros and cons and it really depends on the borrower. When looking to execute a cash-out refinance, it’s important to decide which method makes sense for your unique financial situation.
If interest rates are low at the time you’re looking to cash out, you may want to refinance your existing mortgage and consolidate the old mortgage and cash out into a single loan as we saw in the last example.
If mortgage rates aren’t favorable but you still need cash, it’d probably be best to leave your first mortgage alone and add a second mortgage behind it. That way it won’t affect the interest rate of the first mortgage.
Things like remaining loan term must also be taken into account. If your mortgage is close to being paid off, it may be wise to leave it untouched and opt for pulling cash out via a second mortgage.
But if your mortgage is new and the interest rate is not all that favorable (or adjustable), it might make more sense to refinance the whole kit and caboodle. In any case, there are refinance calculators out there to aid you in your decision.
Why Do People Pull Cash Out of Their Homes?
• Home improvements
• Other investments (stocks, bonds, etc.)
• Vacations and other luxuries
• College tuition
• Home buying (down payment to purchase another property)
• To pay-off other higher-interest-rate debt, such as credit cards or auto loans
• Pay off student loans or a personal loan
• For an emergency (buffer their checking account)
• Because they want cash for any number of reasons
There are countless reasons to refinance depending on your financial goals.
While a rate and term refinance can be helpful to lower your monthly payments and/or drop mortgage insurance, cash out refinance loans are good for, well, getting cash.
Many homeowners use cash-out refinances for debt consolidation, home improvement, or for future investments. To avoid paying high-interest rate credit card debt, homeowners may use cash out to pay off those bills.
Instead of paying a 20% interest rate or higher on a credit card each month, you can pay off that balance using your mortgage and pay a rate of 5-8% instead.
Just realize the risk involved if you fail to make your mortgage payments. And consider a balance transfer instead if it’s just credit cards, you might be able to get 0% APR for a lengthy period of time.
Other homeowners may pull cash out to make improvements to their home that will increase the market value significantly, which over time can lower their loan-to-value ratio and increase the equity in their home.
Others may pull cash out if they feel they can invest the money at a better rate of return than the mortgage rate.
The question you need to ask yourself is whether it makes sense financially to refinance your current mortgage to take advantage of anything mentioned above.
Keep in mind that there are fees associated with taking out a second mortgage, and even more if you plan on refinancing your first mortgage and taking cash out.
While a cash-out refinance can provide homeowners with much needed help in a dire situation, when you cash out, you essentially reset the mortgage clock and lose all the equity you’ve spent years building. Not only do you lose your equity, but you also take on more debt.
How Are Cash-Out Refinance Rates?
- There is a pricing adjustment for cash-out refinances
- They are more expensive than rate and term/home purchase loans
- How much more expensive depends on things like your credit score and LTV
- If you have a very high LTV and a very low credit score your cash out mortgage rate could be very high
They’re generally pretty similar to those of a home purchase or a rate and term refinance, though this can vary based on credit score, LTV, and so on.
Some borrowers may only see a mortgage rate .125% or .25% higher if they have excellent FICO scores and a low LTV.
In other words, if the rate were 3.625% without cash out, expect the cash out refinance rate to be 3.75% or 3.875%, all else being equal.
Depending on the loan amount, that can amount to a few extra bucks or $100 or more per month.
However, if you happen to have marginal or poor credit, your interest rate could skyrocket if you’re taking cash out. Same goes for a high-LTV loan, and even worse if you combine the two!
Also note that a refinance with cash out will obviously be larger, so that can drive the monthly payment higher as well compared to your original home financing.
Like a purchase mortgage, both fixed rates and adjustable-rate loan options are available on a cashout refi, along with interest-only in some cases.
Cash-Out Refinance vs. Debt Consolidation Loan
As mentioned, some homeowners will utilize a cash-out refinance as a debt consolidation loan.
But instead of simply tapping equity and putting the proceeds in their bank account, they pay off existing debts at closing.
So in essence, it works in opposite fashion because the borrower isn’t taking on additional debt. They are reducing the cost of existing debt via the refinance.
For example, imagine a homeowner with $30,000 in credit card debt and another $20,000 in personal loans, with respective APRs of 20% and 12%.
The borrower elects to refinance their mortgage and pull $50,000 out on top of their outstanding balance to pay off that $50,000 in non-housing debt.
While they pulled cash out of their home, they didn’t increase their total outstanding debt. They paid it off and consolidated those existing balances into their mortgage.
These balances are often paid off via proceeds from escrow at closing so the borrower doesn’t actually receive cash in hand.
In the process, they also reduce the cost of their debt, because their hypothetical mortgage rate might be 6% versus the 12-20% on their old loans.
How does this differ from a standard cash-out refinance? Well, that would imply taking on additional debt that the borrower didn’t have prior.
An example being a kitchen remodel, where they now have another $50,000 in debt on top of their old mortgage and any other non-housing debt.
So while a debt consolidation loan is very similar to a cash out refinance, and largely the same process, there are some key differences.
For the record, you could also just get cash out proceeds via the refinance deposited into your bank account and then pay down your other debts on your own.
But it might help you qualify if those debts are paid off at closing and excluded from your DTI ratio, assuming you’re cutting it close.
Pros and Cons of a Cash-Out Refinance
The Pros
- A relatively simple way to access the equity in your home (via a traditional mortgage)
- May be able to pull out a lot of money depending on property value and outstanding balances
- Could be much cheaper to borrow versus alternatives if mortgage rates are favorable
- Might be tax deductible if used for qualifying purposes such as home improvements
- Long repayment period makes for manageable monthly payments (often up to 30 years)
- Fixed payments that don’t change if you choose a 15- or 30-year fixed mortgage
The Cons
- Have to go through the mortgage process (again!)
- Larger loan balance means higher payments and more interest paid
- Will restart your amortization schedule unless you choose a shorter term
- You lose your existing mortgage rate (assuming it’s a low one you want to keep)
- Have to pay closing costs like you would a normal mortgage
- Might be restricted to how much you can borrow (low LTV limits)
- May require a higher credit score to obtain financing
- Seasoning requirements may not allow it for X amount of time after purchase
Cash-Out Refinance Frequently Asked Questions:
Now let’s tackle some questions you may have (or may not even realize to ask) about cash out refinances.
What is the seasoning requirement for a cash-out refinance?
Most lenders will not let homeowners take cash out on their property without 12-months seasoning. Meaning that if you buy real estate, you’ll need to sit on it for at least a year before taking any cash out.
Lenders enacted tougher cash out rules to deter investors from buying homes with zero money down, and quickly refinancing them at a higher value and zapping the equity.
There are some lenders that will allow cash out up to 75% loan-to-value without any property seasoning, but most homeowners who are looking for quick cash out usually do not have 25% equity in their homes.
What is the max LTV for a cash-out refinance?
Seasoning aside, there are typically strict limits on how much cash out you can take. At the moment, most lenders allow a max LTV of 85% for cash-out refinances.
In the “good old days,” you could get cash out at 100% LTV, meaning you could take out refinance loans for the full value of your property. Clearly this didn’t go well once home prices plummeted and lenders were stuck holding the bag.
Do I lose home equity after refinancing?
You don’t lose it, you use it! And as a result, you have less available home equity because it has now been tapped.
For example, if you owe $200,000 on a $600,000 property and cash out an additional $100,000, you’ve now only got $300,000 in available equity instead of $400,000.
But that money is now yours to do with as you please.
How much can I cash out refinance?
After considering the max LTV allowed by your lender, you need to determine your property’s current appraised value and outstanding loan balance.
Your borrowing may also be restricted by DTI limits if the new, larger loan balance creates a monthly payment that is too high for your income.
For example, say your home is worth $500,000 and you have an outstanding loan balance of $300,000. If the lender allows a max LTV of 85%, you could potentially take out a loan amount of $425,000.
But the lender would have to verify that you could handle monthly payments on that larger $425,000 loan amount as well.
So max cash out will be determined by both LTV and borrower affordability.
Can I do a cash-out refinance with bad credit?
It depends how low your credit score is. You can generally get approved with a credit score as low as 620, which many would consider bad or close to bad.
Of course, your interest rate will be higher to compensate, so it’s often in your best interest to improve your scores before applying unless you really need the cash.
This logic applies to all types of mortgages, but can be especially impactful on cash out refinances because the pricing adjustments are often higher.
Is my refinance considered rate and term or cash-out?
Another important note is that a refinance loan will be likely be considered cash-out if a borrower refinances a non-purchase money second mortgage.
For example, if you open a HELOC or home equity loan behind your existing first mortgage after the original purchase transaction and then later want to refinance both loans, it will be treated as a cash-out transaction even if you aren’t taking cash out at that time.
What this may mean to the homeowner is another pricing adjustment when they refinance, which will result in a higher interest rate. It’s not the end of the world, but something to consider.
Many borrowers also feel if they aren’t getting cash in their pocket, their refinance isn’t considered cash-out. This is false. If you pay off credit cards or auto loans and receive zero cash in hand, the bank or lender will still consider it cash-out, and it will be underwritten as such.
Is a cash-out refinance taxable?
NO. As mentioned, you aren’t getting free money via the refinance transaction. You are taking out a new loan with a larger balance and you must pay it back (with interest) over time. So there’s no income tax to worry about.
However, you’ll likely have larger monthly mortgage payments to contend with.
Is a cash-out refinance tax deductible?
POSSIBLY. So we know the cash out isn’t treated as income. But even better, it may be tax deductible, though there are limits of indebtedness of $750,000 ($375,000 if married filing separately).
Additionally, regardless of when the indebtedness was incurred, you can generally only deduct the interest if it was used to buy, build, or substantially improve your home.
In other words, if the cash was used to fund a home improvement such as a new bathroom or kitchen renovation in your qualified main or second home it might be deductible if you itemize.
But those paying off non-housing related debt such as student loans or credit cards with cash out proceeds likely wouldn’t qualify for a tax deduction.
This is covered in IRS Publication 936, though still somewhat confusing to interpret, especially in light of the Tax Cuts and Jobs Act of 2017. Tax situations vary so consultation with a CPA may be advisable.
Can I get a cash-out refinance on a rental property?
Yes, though the LTV limits could be significantly lower. We know the max LTV is around 80-85% for primary residences. For rental properties, aka investment properties, you might be looking at a max LTV of 70-75%, or lower. So keep that in mind before thinking you can tap all that equity!
Can you do a cash-out refinance with an FHA loan?
Yes, though the LTV limits are again restricted. For FHA loans, the max LTV for a cash-out refinance is 85%, down from 95% before the mortgage crisis. HUD lowered the max LTV as a result of deteriorating conditions in the housing market.
In other words, if home prices keep dropping and they continue to offer cash out up to 95% LTV, they’ll lose their shirt.
Can you get cash out with VA loans?
Yes, as long as you occupy the property as your primary residence. And it may be possible to get up to 100% LTV financing depending on the circumstances.
Additionally, you can use a VA cash out refi to refinance a non-VA loan (FHA loan, USDA loan, conventional loans) into a VA loan.
Is cashout refinancing allowed on jumbo loans?
Absolutely! It’s possible to get cash out with your jumbo loan, and the loan limits might be much higher than other loan options. The downside is the max LTV might be lower to compensate for risk, so you’ll probably need a fairly large equity cushion.
Is cash out allowed on a streamline refinance?
No, streamline refinances are only intended to help borrowers lower their monthly mortgage payments and/or move from an adjustable-rate product to a fixed-rate product. A cashout loan wouldn’t accomplish that saving money part.
Where can I get a cash out refinance?
Pretty much any financial institution that offers home loans will also offer cash out refinances. There aren’t really so-called refinance lenders per se, though there are certainly lenders whose volume consists mainly of refinances as opposed to purchase mortgages.
Any bank, credit union, or mortgage bank should offer these refinance options.
Will a cash-out refinance take longer to pay back?
With any mortgage refinance, it is important to understand the costs involved and the underlying motivation. You should avoid serially refinancing your mortgage if at all possible.
Aside from the associated costs, if you constantly take cash from your home, you will set yourself back in paying off your mortgage, and wind up paying more interest than if you simply left the mortgage alone.
You could also land yourself in a negative equity position. That’s why a cash out refinance should really only be reserved for times of great need, or in times when rates are simply too good to pass up.
Do your homework (lots of it) and run the numbers through a mortgage calculator before making a decision!
Tip: When to refinance a mortgage.

- Firing Jerome Powell Won’t Benefit Mortgage Rates - July 16, 2025
- Here’s How Your Mortgage Payment Can Go Up Even If It’s Not an ARM - July 15, 2025
- The Past Month’s Mortgage Rate Rally Has Nearly Been Entirely Erased - July 14, 2025
Hi,
I currently have a FHA loan for about 200k. We have some credit card debts of about 15k and have looked into a cash-out. My question is we are paying PMI at about $200 a month. My current rate is 3.75 and I’m being quoted for about 4.5%. I really don’t want to change my rate that much but I also hate paying PMI. My house is worth about 335k. What’s your suggestions? Cash-out and pay the higher interest rate or a 2nd mortgage or just stick it out?
Thanks
Matthew,
Depends on your goal for the home/loan and how badly you need money…do you want to pay off the loan eventually or do you think you’ll move after just a handful of years. How many more months of PMI are due? A lot of questions…probably best to sit down and weigh pros and cons and do all the math with different scenarios. Most people don’t refinance to a higher rate. A home equity loan could work for your cash needs if you don’t want to mess with the existing first mortgage.
I’m considering a cash out re-fi on an investment single family house. I would like to pay myself back for the pool I put in at the investment house and make improvements to my primary residence. Mortgage is currently $150,000 and house will conservatively appraise around $350,00 – $365,000. I can get 65% LTV which is plenty. I understand there is no tax hit on the re-fi cash out monies, but is there a new cost basis when I sell? I originally purchased for $199,000. Will the cash out re-fi reduce capital gains?
Di,
That’s a tax question you should probably discuss with your CPA.
I live in Texas and we want to do a cash out refi to purchase another property. My parents live in a mobile home that they own, that is on my acre with my house. Two separate families, two households, does this still qualify for a single family residence for a Cash out refi? If not are there any other financing options to accomplish our goal? Desperate!!
Need reply ASAP.
Stephanie,
Sounds like it could be tricky. Generally you want your home to be the main piece of collateral, not the land, or a mobile home on that land.
Hi Colin,
We currently have $57k (4 yrs, 10 mos.) remaining on a 15 yr cash-out refi @ 9.6%. (Our credit really sucked at the time as my husband had lost his job.) House is appraised at $160K with a market value of $180K per our tax records. FICO score 730. We are considering refinancing again with cash-out to pay off the high interest credit cards and do some home upgrades. We would actually lower our payments if we did a 15 year refi or pay the same if we did a 10year refi. We plan to stay in our house and have about 10 years left to work. Thoughts? Thank you!
Terrie,
It’s personal preference really…what your financial goals are, etc. You reset the clock again on your mortgage to 10-15 years depending on what you go with, as opposed the ~5 years remaining now but as you said, payments are lower and you tackle your other higher-APR debt. And you could always prepay your new mortgage faster if you want to avoid any extra interest expense from a longer amortization period.
Considering refi current mortgage of $143k, home value $220k, with cash out of $25k. APR currently 4.25, refi will be 5.25 and $100 more in mortgage payment. Just cashed out 401K to pay off credit cards and want to replace the nest egg. Is this something we should consider, or just keep current mortgage and refi if we need a nest egg?
[In Texas.] Last year I did a cash-out refinance of my mortgage [which also rolled in a home equity loan]. I was attempting to get a home equity loan now, but I’m being denied because my first mortgage is now considered an equity loan and am being told that Texas doesn’t allow two equity loans at the same time. I’m being told the only way that I can tap into the existing equity, is to re-finance the first loan. Not an option since current interest rates are worse, plus I don’t want to reset the current remaining 14 years of that first loan’s term. Do I have any recourse to tap into my “available” equity, or am I simply S.O.L. until I fully pay-off (or refinance) that first loan.
Lee,
I believe in Texas a home equity loan can only be refinanced with another home equity loan, so that would mean you currently have a home equity loan, limit of 1 as you noted. Might want to speak with more Texas-based lenders to see if there are any workarounds. There are also home improvement loans if the money is being used toward renovations.
Laurie,
The short answer: If the nest egg money gets a better return than the higher mortgage rate and you don’t mind restarting the clock on your mortgage. Or paying an extra $100 a month. Also consider closing costs of new mortgage and max 401k contribution limits.
Trying to decide which mortgage transaction to obtain first. We are currently waiting for a clear to close on a cash out refinance to pay off student loans and auto loans leaving a 80 % LTV. In the interim, we are waiting for a clear to close on a mortgage of a principle residence in which we want to have a 20% downpayment to avoid PMI. Are there any time constants in doing both mortgage transactions?
If a property was bought subject to, can the owner of the mortgage do a cash out refi or can the deed holder borrow against the property even though there is a primary mortgage on the property?
I have no mortgage and want to do cash out refiance, does it make sense?
Jon,
It can if you need the money for something and the interest rate is better than what you’d get elsewhere. But like anything there are pros and cons. Do the math, compare to other options, etc.
Colin,
We bought our home 2 and 1/2 years ago. We live in southern Oregon. We would like to do a cash out refi in order to pay off credit cards and a car payment. We paid out of pocket to have our home appraised. It appraised for $190k. We owe $160k. But according to all of the brokers I have talked to, that $30k in equity is inaccessible even though we make good money and our combined credit scores are >740. We do not need all of that $30k. We only want to utilize $20k. Is there ANYONE out there who is willing to do something like this?
Andria,
The LTV may be too high to tap into that equity, at least with the brokers you’ve spoken with. But you might be able to take out a home equity loan to get access to that money and leave your first mortgage as is.
Mr. Robertson, I have enjoyed reading the questions and your advise/responses on HELOC, Loans & Cash Outs.
I have first VA 30-Year Fixed Mortgage started in 09/2012 so still fairly new, with 3.75% interest rate, for mortgage balance of $238,000 with $321,000 appraised value. Thinking of taking Home Equity Loan of $320,000 with Cash Out to reduce high credit card debt & to pay tuition for daughter who starts college in Fall 2016. New rate I qualified for and offered by lender is 3.50% for new/similar VA 30-year fixed rate. Although I think I understand pros/cons of cash out to consolidate/pay-off high interest credit card debt, majority of articles on topic advise against doing so…using refinancing/cash out to pay off high interest CC debt. It has me a bit cautious, although terms seem favorable and I’m financial secure (good job, pension, 401k), of course, other than carrying a lot of high interest credit care debt & high monthly interest payments that I would really like to resolve.
I just received lender’s closing disclosure & total closing costs (initially project at $3400 but now $5000), other than appraisal & termite inspection, so I guess I’m just double & triple checking to make sure its the right decision.
Thoughts / advice? Thank you.
Dave,
Those articles probably state that you can lose your house if you don’t keep up with payments, which is the general argument. But credit card APRs are excessively high and if you need money for college tuition then borrowing it at 3.5% seems pretty low relative to other options. It’s your choice and obviously you’ll need to be able to afford the larger loan amount that comes with the cash out.
Does cash out or rate to term refinance remove PMI on a FHA loan as well as possibly get a lower interest rate…I ‘ve been in my house 2 + years. Interested refinance to get car and get lower current 4.25 interest rate …how much does interest rate need to be to make diffence in the mortgage payments ….pls advise
Valerie,
It can remove MI if you refinance to a conventional loan and the LTV is 80% or less. Rate difference depends on your personal situation and what you plan to do with the home/loan over time vs. other alternatives for your money.
I have an fha loan with a balance of $790,000 with a fixed rate of 3.25%. 3 year old loan that I am paying MI of almost $900 a month. My property value has gone up to $1,400,000. If I refi to a conventional loan and get $50,000 cashout, will I still have a new lower payment? I’m looking at a rate of 3.75%. Also was considering a biweekly payment schedule. Will this reduce my current payment? And still save me money by doing the biweekly payments? Even though the new loan is at a higher rate?
Dan,
Depends what the MIP costs…the upside is you will drop MIP if the new loan is under 80% LTV, which it sounds like it will be. Did you calculate the new loan amount at that rate to determine the monthly payment? The biweekly thing would actually mean that you pay more every year since you make 13 monthly payments (26 half payments).
Mr.Robertson, I have to come up with some cash of 12980.00 & 9800.00 to pay off cards. My house is close to being paid off the bal.is 5800.00. I’m thinking of a cash refinance from what I have built thur the years. And interest rate low and just have one payment. Do you think this is the best way to go? Or is there anything else you think I should think about? Thanks Kevin
Kevin,
That might be one way to do it…there are also balance transfers with credit card companies that can offer low rates as well (sometimes 0%) without getting the home involved. Problem with mortgages is that the term is so long (e.g. 30 years) unless you go with a shorter term loan. Could also look into home equity loans and leave your first mortgage alone. Depends on the interest rates involved and your financial goals in terms of what’s favorable.
Colin,
What are your thoughts on cash out refinancing to get my tax bracket down. My income will go up significantly this year and next and I expect our tax bracket to go up. Am thinking of cash out refinancing our home of $750K value from its outstanding $330K mortgage. We have 12 years left on our mortgage. Is the amount of additional interest outweigh the taxes paid on income?
Thanks
Roger
Roger,
Might be a question for your CPA or tax advisor. Generally cash out is taken for a specific purpose such as to buy another home, invest, pay for a large cost, etc.
We are trying to refinance and our lender talked us into an FHA over a conventional loan. We are appraised at 255,000 and owe 204,000. They are stating we can only take out 10,000 cash. Do you know why? I thought we could take out up to 85%. Thanks
Natalie,
That’d be pretty close to 85% as it stands. Make sure you consider all options, including a second mortgage such as a HELOC or home equity loan to keep the first at/below 80% to avoid mortgage insurance. You can always just refi the first without cashing out (assuming you want a lower rate and/or to drop MI) and get a second for your cash needs.
Colin I owe 16,835 on my home with 5 years left. i need money for major repairs should i do a cash out or refinance with 2nd mortgage, i wanted to get about 20,000 of my home equity
Berneice,
If you’re loan is nearly paid off chances are the payments are mostly principal and very little interest, but it depends on the interest rate. A second loan (home equity loan/line) may make sense.
Colin,
I use to be a mortgage broker however, I am not very familiar with what has changed over the past several years. I and another party own my primary residence with no mortgage or liens. I want to buy him out and payoff all of our joint debt at 60% LTV. Would this be considered a refi or purchase since the deed would be changed? Also, what would you recommend for the fastest possible out come, “Quicken, Lending Tree,” or a local vender? The 60% includes closing costs, payment of consumer debt, A big fat check for the other owner and possibly a little cash in the bank… if there is anything left without increasing the LTV.
I have a first mortgage of about 30K and a prime equity tied to prime interest rates of 600k property is worth around 1.5m.
Will another bank refinance the 1st mortgage with a prime equity on the property all ready? I want to get a refinance of 250k?
Patty,
They may permit a refinance but consolidate the existing loans into one or just two loans total.
Amy,
Sounds like a refi…you may want to get with some brokers to discuss the best course of action…those big lenders probably aren’t the best for this situation since it’s not totally cut and dry, but who you use is up to you.
We bought a home with a FHA loan 9/2015. Now we realize my husband qualifies for a VA loan. We are wanting to refinance to get rid of the MI and get some of the cash back we put down. The current loan is 210000. The appraised value was $235000. We are retired on a fixed income with good credit and no debt but with a limited monthly income. What would you advise?
Jan,
Probably best to compare all options that you can qualify for, including conventional to determine what the best deal is for your situation. But VA could make sense if you need cash out and want to avoid MI. There might be a funding fee to pay though.
I bought a house 5 years ago and my mortgage balance is $79,000. The home is valued at $125,000. I am doing a VA refinance to get rid of $30,000 in credit card debt and student loans. I am supposed to receive the balance of $12,000 or so back from the bank.
I was just told that I would not receive the money until 3-5 business days after closing. Is this routine or should I be worried?
I owe 70,000 on my home and have a HELOC that has a 23,000 balance. My home is valued at approx. 390,000.
I want to purchase another home in another state as my primary residence. Can I and would it make sense to pull cash from the equity to purchase another home? Refinance?
Taylor,
This is a common thing people do but paperwork probably states you intend to occupy current residence as primary for X amount of months.
Hi Colin,
Great site with a lot of good information. I have a town home that I use to live in but is now a rental property that has a 87k balance left on it with 21 years/4.75 ARM. The house is valued at 127k. I want to refinance to a lower fix and pull 20k out to pay off student loans.
Which option do you think is best for my situation?
Joe,
Depends if you want to refinance the existing ARM or just add a home equity line/loan behind it…could potentially do a new single loan with added cash out though LTV limits may prevent you from getting the entire amount desired. Rate could also be steep but may want to explore both options to see what makes more sense for you personally.
Hi Colin,
home value is 250 amount owed on home is 90,000/ 3.95 interest fixed rate 12 years left… I want to buy and investment property bank owned (55,000) and pay off my wife’s student loans( 25,000 at 6.8 %), cash offer from me. When i went in for the heloc they advised me to go see and refinance at a lower rate then they could provide. Now my closing is set about 45 days. and the bank raised the interest rate of the refi to 4.125 for 30 year…becuase they add points on cash out refi or i could pay off points( this confused me,can u clarify ……) now the bank has started my loan but i feel like i missing something?
Jason,
Generally there are pricing adjustments for a cash out refi that raise the cost and/or interest rate of the loan. So they’re probably telling you that you can lower the rate by paying points (prepaid interest) at closing or just stick with the higher rate to keep upfront costs low/null.
Re the $100K max non-taxable – is that amount reduced if some of the cash is used for purchase of a second home, rather than your example of home improvements? And do the home improvements (or 2nd home purchase) have to be completed in the same calendar year ?
I want to do a cash-out refi on my primary home for 80% of its $315K value, which could give me as much as ~$111K as the current remaining mortgage is $127K.
I plan on using the majority of that money for downpayment on a 2nd home.
My concern is the IRS max of $100K. If I invest in the 2nd property, rather than home improvements, does that avoid the $100K cap? And if I upgrade current home to avoid the $100K cap, does it have to be done in the current year?
Dave,
Best to speak with your CPA or tax advisor to determine that.
Have an $800,000 primary residence mortgage free. What are the pros/cons to getting 200,000 cash out loan on this primary residence to pay off rental property.
Mark,
Just a tradeoff in terms of interest rate on the cash-out loan versus what you’re paying on the rental currently. And I suppose some people don’t like their primary encumbered, but sounds like a super low LTV and plenty of equity.
I paid cash $350,000. Can I get a home equity loan for $285,000(80%) or $262,500(75%) is the max? I just bought it, do I need to wait 6 months in order to get the loan?
Ray,
Typically there is a six-month seasoning period before you can cash out if you just purchased a property, but not all banks may make you wait. The max LTV will also vary by bank so probably best to shop around to see what’s available.
My first mortgage will be paid off in less than 6 months. I have a second mortgage that I would like to refinance to obtain a lower interest rate and also would like to pull cash out for home improvements. What type of loan would be best?
Kelly,
Could get one new loan that pays off both the existing loans while tacking on some extra for those home improvements.
I have no debt so 100% equity in my co-op which is appraised at 1.7M. The co-op also owns the retail storefronts, the rents from which are paid to us shareholders as quarterly dividends. I have 300000 in a TDA and 200000 in investment funds. I would like to take a 900000 mortgage to buy a second home, renovate my first home and rent it out at 9000 monthly to repay the loan. my credit is 730. banks wont give me a loan because I am an artist with non traditional income. They will not consider the increase in value after renovation and the rent that will be achieved, and so will not give me the loan despite being fully collateralized. How can I get the cash out of my property without selling it? Since the storefront dividends exceed the maintenance costs it is an asset I do not want to sell.
Murray,
If you’re light on income, but heavy on assets, you may want to look into asset depletion as a means to qualify and/or check out financing options with a non-QM lender.
I live in Michigan and I am refinancing a first and second mortgage into one, no cash out, or so I thought. The combined loan to value (CLTV) is 76% and the new mortgage amount is $233,000. Credit is considered good to excellent and the debt to income ratios are good to excellent. Even though my second mortgage is13 years old, my first is 16 years old, the lender is calling this a “cash out” refinance. At one time I know there was a two year “seasoning” requirement on a second mortgage, but the loan officer is telling me it is forever now. As a borrower, this definitely sounds like a penalty because they are now quoting .125 percent higher interest rate on a thirty year, and .625 percent higher on the 5 and 7 year ARM, which is what I was most interested in. Is this really true? And then how long after can I refinance again and be offered all the rates and programs with no “penalties”?
David,
Could be because you’re paying off a non-purchase money second mortgage, which is treated as cash out. Also, may want to see if you can get the LTV to 75%…pricing generally improves at 75%, 70%, etc…each 5% tier, so 76% basically pushes you into 80% territory.
I want to refinance my home and pull out cash to remodel house. However I have IRS tax liens, but I am on payment plan with them. If I took cash out to remodel would IRS take it because of lien even tho on installment agreement?
Teresa,
You can ask some lenders, but you’ll likely need to pay off the IRS lien with the proceeds…but perhaps you can get enough cash to do that and cover renovations.
I’m paying all cash for a house (to make my offer more attractive to seller than other bidding buyers), so I’ll have 100% equity at close of escrow. Then I’d like to pull out 60% in cash out, leaving 40% in so I can get the lowest interest rates. One mortgage broker told me that, if I do this within 60 days of close of escrow, my ‘cash-out-refi’ qualifies as a “deferred purchase”, which earns me a lower interest rate (same as a new purchase mortgage?) than a conventional cash-out-refi at a later date would. But I can’t find any published rates (nor any info on web) for this so-called ‘deferred purchase financed within 60 days’. Does it even exist, and if so, does it indeed offer lower interest rates than a conventional cash-out-refi? Thanks.
Peter,
Check out “delayed financing” and you should see some material on the subject. Not sure rates will be lower but you may not have any pricing adjustments at 60% LTV on a primary residence anyway. Pricing could be pretty comparable.
My homes current value is $40,000 and my credit card debt is $7,000. I purchased my home in 2002 for $26,400 with a 30 year loan and still owe $22,000 on the mortgage. Is there anything I can do to combine my credit card debt into my house payment to get a better interest rate and just have 1 payment for house and debts? I need some guidance on what to do please.
Elizabeth,
It may be possible to get cash out from your home to pay off the credit cards via refinance, especially with your mortgage balance so low relative to your current value. If mortgage rates are lower than they were in 2002, which is very likely, it could be a double-win. Just note that your mortgage balance will be larger as a result and you’ll restart the clock if you go with another 30-year mortgage. Not necessarily bad things, but things to consider.
My house was appraised at 615k recently. Owned home for 6 months. Paid 550k, put 20% down. 30 year, 4.25% with decent credit and co-signer with excellent credit. I want to cash out 54k and refi the loan to start a new 360 month term. Is this possible and if so what closing costs do you think I’m looking at?
Chris,
Sure, as long as you qualify otherwise and can get the value necessarily to keep the LTV where it needs to be. Closing costs can vary a lot, depending on if you pay points for your rate or receive a lender credit to cover most of your costs. Your costs may also be higher if you have impounds and have to contribute to an escrow account at closing.
Hi Colin, I wonder if you can give me some advice. I was made redundant in Feb 2017 and just got back into work this month, (May). I missed a couple of mortgage payments as a result and maxed out a credit card as we struggled to keep our expenses paid up. I was thinking of pulling some equity from our house to pay off the credit card and catch up on the missed mortgage payments, does this make financial sense to you? Basic numbers for our property are: market value ~$520k, lien balance ~$300k. I am worried our credit score will be low now with the last three months of struggle. Any advice/thoughts you can offer would be greatly appreciated. Alan.
Hi Colin, I am thinking of pulling some equity from my property to catch up on a couple of missed mortgage payments and some credit card debt, is this advisable in your opinion? The house is worth about $520k and the lien is roughly $300k, I was thinking of pulling $50k. Which option would you think is better for me, the second mortgage or the cash out? Many thanks, Alan
How do I find someone to trust to help me with a refi? We had a problem with a major Bank before but we need to refi and take some equity out. Our mortgage rates now are 6.75 we need to refinance. Our home is worth 250.000 and we owe 153.000 wanted to take 20,000
Peggy,
It sounds like you’re a good candidate to refinance with a lot of equity and a high mortgage rate, assuming your credit is good. There are many options for a loan; online lenders (for which you can read reviews), local credit unions and banks, or mortgage brokers. You can find reviews and/or ask for references and vet them. To ensure you get the best price, you can comparison shop with several at once. The more you know about your own mortgage situation, the more control you’ll have over the process because you’ll know if someone is being honest or misleading if you know how it all works.
Hi Colin,
We own a home outright that we want to sell but we need to get cash out to make some improvements before that can happen. We can’t get a home equity loan due to low credit scores, so looking at possibility of cash out refi. Do you know if there are any rules or penalties around how quickly one can pay off their cash out refi? Plan would be to pay it off as soon as we can sell the home.
Thanks in advance!
Megan
Megan,
There are no longer prepayment penalties on most mortgages so early payoff likely won’t be an issue. However, a loan officer may tell you 3-6 months because loans that are paid off too fast can result in a commission clawback for the originator.
The underwriter wants me to write a letter explaining what I’m doing with the cashout refinance. I have excellent credit, a stable job that pays well, owe less than $10k on my home, the appraisal same in $20k higher than I estimated, and I’m only asking for 80% LTV. I thought I could do whateverI wanted with the money. I did not have to explain the last loan 9 years ago when I was not as financially stable. Why now?
Judy,
It’s a typical condition where they ask what you’ll do with the cash proceeds, e.g. to fund home improvements, to set aside liquid reserves, etc.
hey…question: im planning to do cash out refi and spoke to 1 bank; my house market value is $475.000, i owe 252.000, planning to get $100.000, the guy i spoke to told me the “estimate loan amount” is 355.000,,,here is my question:
$475.000 – market value
– $100.000 – cash out
= $375.000 – after cash out
if the loan amount is $355.000 where is the $20.000 go?
thanks guys
You seem to be doing the math in reverse based on the value, not the outstanding balance. If the current balance is around $252k, add $100k to that and it’s around $352k, then the bank rounded up a bit to perhaps cover closing costs, making it $355k.
We purchased our home a little over a year ago and the loan balance is now 270,000 but the market value is 310….we were told by the guy who does our mortgage that we have to wait until the home is valued at 350-360 before we can refi …this doesnt seem to make sense to me that our home would have to go up in value by more than 60k before we can refi…does this make sense?
D,
It sounds like your guy wants the loan-to-value on the refinance to be under 80%, whereas it currently stands around 90% based on the $310k valuation. That can make it more difficult to qualify for a refinance, or to at least make one worthwhile depending on what your interest rate is now and what you’re attempting to do. You can ask for clarification and options based on the home’s current value so you fully understand the situation.
Hi, we are in the process of doing a cash out refi. The home value came in at 204k we owe 151k they are offering a new mortgage of 171 closing cost are looking like 7k which seems high to me it’s a fha loan. I feel like we should shop around more . Also we first tried for a home equity line but were declined because they did a drive by appraisal which only came in at 189k can we use this appraisal we just got from the mortgage company to try for the cash out refi ? Thanks
Michele,
If you don’t like the costs, shopping around should give you a better idea of what’s reasonable. As far as the appraisal goes, you can request that a new FHA lender you work with use the old one. Have you looked into conventional options? Is there a reason you’re going FHA and also keeping your LTV above 80%? Pricing might be more favorable if loan is kept at 80% or less, and you can also avoid mortgage insurance if you go conventional.
Does a bank have the right to ask you the reason for the cash out if you have sufficient equity (50% LTV) and excellent credit as well as 10 years on the job?
Robert,
It’s a pretty standard condition these days – usually borrowers have a specific reason, such as for a home improvement project or some other expense, or sometimes simply for increased liquid reserves.
Colin, I plan to do a cash out refi totaling 350K (payoff the first (210k), a HELOC (90k) and put about 50k in cash in the bank for emergencies). So that’s 150K cash out. With the new tax law, if I leave the 50K in cash in the bank, is all of the interest on the full 350K loan tax deductible? I know if I spend it on home improvement it is, but what if it is just sitting in the bank?
Jon,
Perhaps a CPA may be able to answer to your question.
Colin,
I am taking cash out of my home during a refinance, but I am unsure of how much. I could go up to the max allowable, and I could afford the payment, though it isn’t really preferred. However, my home does need a good amount of updates and repairs, so the money would not go to waste. My question is this, if I take the maximum out of my equity, use it for repairs and upgrades, then have money left over…could I just then repay the money and recast the loan over the remaining months left on the mortgage? What would be the pros and cons to doing this, besides the small fee for recasting? As I understand it, recasting the loan would not affect the rate. Currently, the rates are really low, and money usually doesn’t come this cheap. I’m doing a refi at 2.5 percent, and they’re actually giving me credit to do so. Let me know what you think!
Don,
A recast is generally used to lower monthly payments as opposed to saving on interest because they re-amortize the loan but keep term the same. If you had cash left over, you could apply it to the principal balance to reduce your interest expense, though monthly payments and interest would not change. You also never know, rates may go even lower…
Colin: I am on my 6th year of a 30 year mortgage (balance $115,287) at a @ 2.25% rate (we closed with NACA) and also have an equity loan (balance of $21,652) at a rate of 4.99%). We want to refinance to take around $26,000 cash out to pay some credit cards. Would it be wise to refinance if we get a lower rate? I have been working with an on line bank and they have given me an option of taking $168,000 at a 2.12% rate with a monthly payment of $1,091 with $6,367 buydown points and around $3,000 closing costs.