They say real estate is cyclical, much like the stock market and the wider economy.
It ebbs and flows, goes up and down, experiences booms and busts, can make us feel rich one day and poor the next.
It doesn’t follow a straight line up or down over time – instead, it can be rather erratic, thanks to, well, us.
We speculate, we get emotional, we create all sorts of creative financing to keep the party going, even if it doesn’t fundamentally “make sense.”
And it seems now the state of the housing market is being seriously questioned. So, are we finally peaking?
Housing Bubble Chatter Seems Positively Correlated with Higher Mortgage Rates
While I continue to argue that home prices and mortgage rates can be negatively correlated, it seems housing bubble fears and higher interest rates share a positive correlation.
In other words, with mortgage rates surging, housing bubble anxiety is also beginning to surface just about everywhere.
It’s not just a quiet side conversation anymore. Instead, you’re seeing it in the headlines daily, and even the Dallas Fed is weighing in.
The researchers and economists at the Federal Reserve Bank of Dallas released a new blog post titled, “Real-Time Market Monitoring Finds Signs of Brewing U.S. Housing Bubble.”
In it, they argue that housing “is in the primary expansionary phase of a bubble when price rises are out of step with market fundamentals.”
But they stop short of calling it a “bubble,” noting that there are valid reasons why home prices have surged since bottoming in 2012 and accelerated even more since 2020.
Some of those drivers include changes in disposable income, low mortgage rates, supply chain disruptions, and the rising cost of labor and raw construction materials.
The worry is that a “widespread belief that today’s robust price increases will continue,” driven by FOMO, will create explosively higher prices and an eventual bust.
That’s all pretty straightforward, but the question remains; when will this happen? Or is it already happening?
Keep an Eye Out for Exuberance

The Dallas Fed bloggers refer to exuberance as “expectations-driven explosive appreciation,” which deviates from market fundamentals.
Put another way, home prices no longer rise for real reasons, but instead are climbing simply because we expect them to.
Throw in accommodative financing to foster this unhealthy environment and you’ve got a real problem on your hands, as we did back in 2006.
At that time, banks and mortgage lenders threw out all underwriting standards because they assumed property values would keep increasing.
So even if you gave someone a no money down mortgage, they’d accrue equity in short order via home price appreciation.
This made the underlying loans seemingly less risky, because the homeowner was expected to quickly gain skin in the game.
Of course, once home prices turned, these borrowers rapidly fell into underwater positions at startling rates.
And then we experienced the worst housing crisis in modern history.
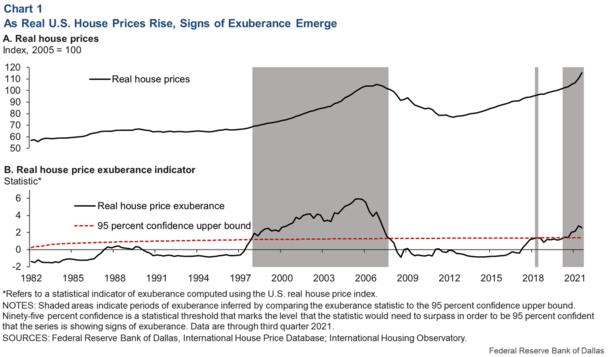
Speaking of 2006, the chart above compares that time to now in terms of “real house price exuberance.”
“A test outcome above a 95 percent threshold signifies 95 percent confidence of abnormal explosive behavior, or housing market fever.”
So based on that chart, we are experiencing housing market fever! The good news is we only caught the fever recently!
If you look at the early 2000s, we had the fever for quite some time before things went badly.
It started just after the turn of the century, and lasted until around 2006-2007 before prices began to dive.
How Much Time Does the Hot Housing Market Have Left?

The Dallas Fed’s exuberance meter has been flashing red for more than five consecutive quarters through the third quarter 2021.
And I think we all know it’s continued to do so thus far in 2022.
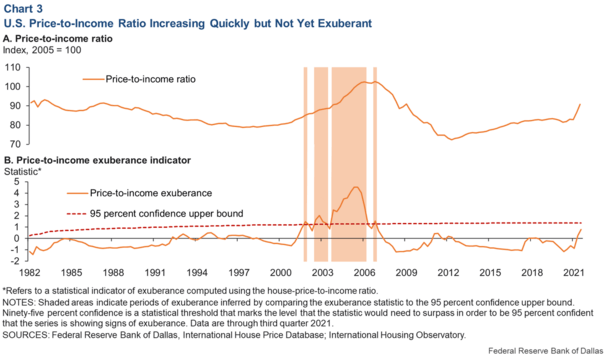
The one bright spot in their research was the price-to-income ratio, which is the ratio of house prices to disposable income.
If you look at affordability back in 2005-2006, price-to-incomes were off the charts. As of the third quarter of 2021, it was still below the 95 percent confidence upper bound.
Of course, that was then, and this is now. The average 30-year fixed mortgage rate has risen from around 3% to nearly 5%.
Clearly that will take a bite out of affordability, and would likely move that indicator into exuberant territory as well.
However, they do note that household balance sheets appear to be in a lot better shape than those in the early 2000s.
Simply put, Americans aren’t holding adjustable-rate mortgages en masse or taking out loans at 100% LTV. There also isn’t a supply glut of housing inventory as there was then.
And they add that “excessive borrowing doesn’t appear to be fueling the housing market boom.”
For me, that’s the biggie – if and when that does occur, that’s when I’d run, not walk.
But whether that happens remains to be seen, which tells me we are still pondering a bubble, not yet in one.
Read more: What will cause the next housing crash?

