
Today we’ll take a brief look at some mortgage rate history to gain a little context for where we stand today. It’s always helpful to know what came before so you can better guess what might come after.
Just about everyone knows that mortgage rates hit all-time record lows in 2021. But do you know what mortgage rates were like in the early 1900s?
The 30-year fixed averaged 2.65% during the week ending January 7th, 2021, its lowest point in history.
Later that year, the 15-year fixed hit the lowest point ever, sinking to 2.10% during the week ending July 29th, 2021.
Some lucky homeowners were able to snag fixed interest rates below 2% for the next 15 to 30 years!
Freddie Mac’s Mortgage Rate Statistics Started in 1971
- Most mortgage rate statistics are tied to Freddie Mac’s archive
- Unfortunately, it only goes back to the year 1971 which isn’t much to go on
- I wanted to drill down a bit deeper to see what things were like prior to the 70s
- And see if I could find data from earlier on in the 20th century to gain more perspective
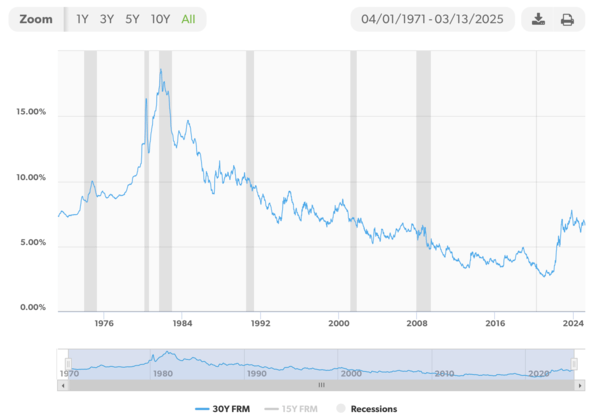
The figure above come from Freddie Mac’s Primary Mortgage Market Survey, which only dates back to 1971.
For the record, back in April of 1971, the first month they began tracking 30-year fixed mortgage rates, the national average was 7.31%.
It went as high as 18.45% in October 1981 and as low as 2.65% in January 2021. That’s quite a range, obviously.
As you can see in the chart, those 18% mortgage rates were pretty short-lived, as were the sub-3% mortgage rates. So ultimately they can be considered outliers in the grand scheme of things.
The 15-year fixed has only been tracked by Freddie Mac since September 1991, when rates averaged 8.69%. In that same month the 30-year fixed averaged 9.01%.
Anyway, I remember a while back when fixed rates were in the low 4% range that the media was going on about how rates hadn’t been this low since the 1950s.
Which made me wonder; where were they even pulling that historical mortgage rate data from?
I never really took the time to see how low rates were back then, but I finally decided to do some digging to get a little more information.
A Little Bit of Mortgage Rate History
- Mortgage rate history stretches back nearly a century
- But the best records only go back to the early 1970s
- The 30-year fixed gained in popularity around the 1950s
- And rates reached a low around 1945 before hitting new lows in 2021
My quest to find deeper mortgage rate history brought me to several out-of-print volumes from the National Bureau of Economic Research, which seems to have the best records out there.
Unfortunately, the details are still quite murky at best. You see, back then there were different types of mortgages, not like the ones we use today.
While I don’t know when the very first 30-year fixed mortgage was created and issued (someone please tell me), they were believed to become widespread in the 1950s, which is why media references that decade.
Before that time, it was common for entities like commercial banks and life insurance companies to issue short-term balloon mortgages, .
These mortgages often featured loans terms as short as three to five years, which would be continually refinanced and never paid off.
These loans were also underwritten at LTV ratios around 50%, meaning it was pretty difficult to get a home loan without a sizable down payment. In other words, homeownership was reserved for the wealthy!
Later, once the Great Depression struck, home prices nosedived and scores of foreclosures flooded the housing market because no one could afford to make large payments on their mortgages, especially if they didn’t have jobs.
Then came FDR’s New Deal, which included the Home Owners’ Loan Corporation (HOLC) and the National Housing Act of 1934, both of which aimed to make housing more affordable.
The HOLC, established in 1933, could explain why long-term fixed-rate mortgages are in existence today.
The purpose of the HOLC was to refinance those old balloon mortgages into long-term, fully amortized loans, with terms typically ranging from 20 to 25 years. Not far off from the 30-year fixed we enjoy today.
In a sense, it reminds me of the Home Affordable Refinance Program (HARP), which lower mortgage rates for millions of homeowners during the Great Financial Crisis (GFC).
Seems some things never change, despite us thinking it’s different this time…
Mortgage Rates Came Down as Loan Terms and LTVs Increased
- Homeownership became more affordable over time thanks to three main things:
- Lower interest rates
- Longer loan terms
- And higher LTVs (lower down payments)
In 1934, the FHA and the Federal Savings and Loan Insurance Corporation (FSLIC) were created, and in 1938, Fannie Mae was born.
All of these entities essentially expanded credit availability and led to more liberal lending standards for home buyers.
Over time, mortgage interest rates came down while LTV ratios and loan terms increased, as you can see from the charts below.
This made homeownership more accessible for everyone, not just those with the ability to bring a massive down payment to the table.
Historical Mortgage Rates in the Early 20th Century
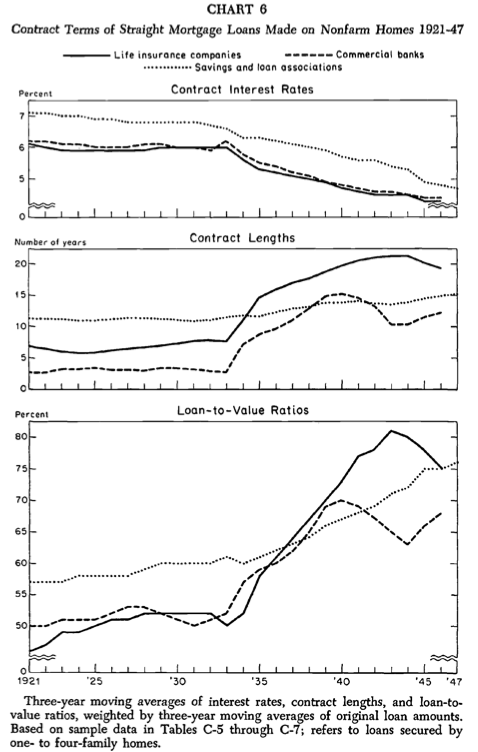
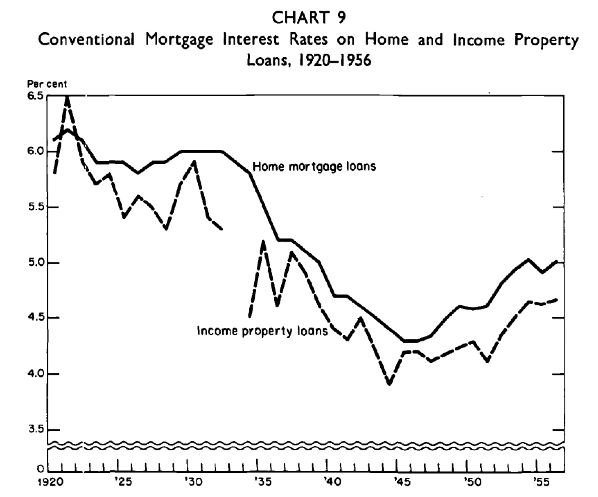
While it’s hard to get an apples-to-apples comparison of mortgage rates before the advent of the 30-year fixed, the National Bureau of Economic Research does have a chart detailing rates from 1920 to 1956.
From about 1920 until 1934, conventional mortgage rates averaged close to 6%, and then began to decline to a low point of just under 4.5%.
This is probably the reference point the media used when they said rates hadn’t been this low in 60 years (back when they dropped in the early 2010s).
Mortgage Rates in the 1920s to 1950s
- We see a steady drop in interest rates from around 1935 to 1945
- Then a bottoming out for a few years before rates began their ascent to as high as 18% in the early 1980s
- Perhaps as the result of World War II ending and all the associated government debt and inflation that came with it
- Exacerbated by a second round of inflation related to the oil embargo that increased input costs for businesses
However, it’s unclear what types of mortgages these were over this extensive time period, and when the 30-year fixed actually became the standard. But it does provide for a little bit of context.
The good news is because mortgage rates went sub-3% in the early 2020s, we can probably consider those to be the lowest on record, despite what happened in the early 20th century.
If we only factor in Freddie Mac’s data since 1971, the 30-year fixed has averaged about 7.75% over that period.
But that includes some very high-rate years in the 1970s and 1980s and some very low years in the 2010s and 2020s.
Many like to refer to rates today as normal mortgage rates, but that doesn’t mean they aren’t a lot higher than they used to be.
In fact, they nearly tripled from 2021 to 2023, from 2.75% to 8%, so normal is a relative term at best.
Since 1990, the 30-year fixed has averaged closer to 6%, thanks in part to the record low rates seen over the past decade.
So perhaps mortgage rates are closer to their long-term average today in the high-6s. But without home price relief and/or higher wages, affordability will remain historically low, which is why home sales have plummeted.

Looks like rates have remained in a pretty tight range for the last 100 or so years. History also tells us they’ll probably gravitate back towards 6% eventually.
Fascinating stuff! Too bad more of these old documents aren’t uncovered, I’d like to know more about the history of mortgages.
Can you please advise me what the interest rate charged by commercial banks was in June 2007 for a 30 year fixed residential mortgage loan? The property is located
in University Place, WA.
Thank you in advance for your assistance.
John,
Per Freddie Mac, the 30-year fixed averaged 6.66% in June 2007, which is a monthly average.
You should also look at the historical data for Social Security interest rates, which normal are about 3 point lower. They have records from 1937 for every year and every month thru 1999 in the historical record and of course every yr. and month since under the current record . For example in Jan 1937 SS recorded interest at 3%. Check it out.
I would love to find 1960s mortgage rate data. I can’t find it anywhere. If someone knows where to find it, can you point to a source, or better yet, post a link?
Same Joe. Unfortunately there isn’t much beyond the Freddie Mac data from the 1970s.