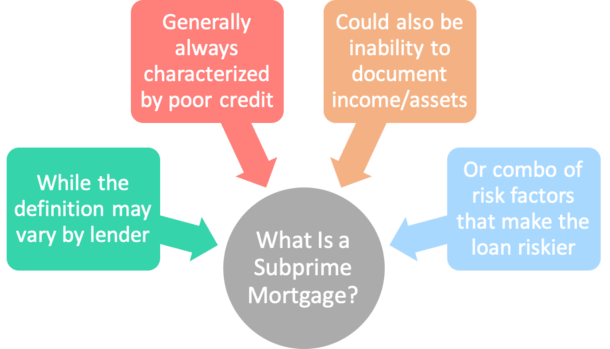
“Subprime mortgage lending” is best defined as offering financing to an individual with poor credit, low income, limited documentation, or a combination of all those things, who generally wouldn’t qualify for a mortgage at standard market interest rates or at all.
If a borrower fails to meet the underwriting requirements of traditional banks and lending institutions out there, they must resort to using a subprime lender who in turn will offer a higher interest rate in exchange for elevated risk. Seems fair, right?
Well, as we know from the massive financial crisis that took place, the subprime market as it was had some major flaws.
The Subprime Mortgage Catch-22
- Subprime loans are designed for those who may have difficulty paying their bills
- They feature higher interest rates than standard prime loans
- To compensate lenders for the increased default risk
- Unfortunately the higher monthly payment makes the loans even more risky
The inherent problem in offering subprime mortgages is that the very people who need them are the same individuals who will probably have the most trouble making their mortgage payments each month.
Simply put, if you present a higher risk of default to the lender, you must pay a higher rate of interest to compensate, otherwise lenders wouldn’t offer these types of loans to begin with.
Unfortunately, this is a bit of a catch-22, seeing that subprime borrowers saddled with even higher interest rates are more likely to default. Think about that for a minute.
Subprime Mortgage Definition Varies, But One Thing Is Clear

- There are different definitions of a subprime mortgage
- But the one constant is a credit score (FICO) below 620
- Other factors may also contribute to this distinction
- Like recent mortgage lates, foreclosure, bankruptcy, inability to document income/assets, etc.
Everyone seems to define subprime a bit differently, but as a general rule, a borrower with a FICO score below 620 would fall into the “subprime” category, also known as “B paper” or “near-prime”.
This is perhaps the best definition of subprime. It’s pretty much credit score driven.
Some may also refer to it as “non-prime,” which might sound a little better than subprime, especially when trying to sell the loans to investors.
Anyway, if a consumer has a score that low, there is a good chance they have major derogatory accounts on their credit report, and/or possibly high credit utilization (maxed out credit cards).
Typically, a sub-620 credit score doesn’t just happen, and is usually the result of a major credit hit.
This may include a collection, charge-off, bankruptcy, or another serious delinquency, such as past due auto loans or student loans, a late mortgage payment, a short sale or foreclosure.
However, their non-prime status might also have to do with something outside their credit reports and/or credit history, such as the inability to document income or employment, or assets.
Tip: How to get a mortgage with poor credit.
Typical Subprime Home Loan Offerings
- Geared toward those with low credit scores (619 and under)
- Or those with elevated debt-to-income ratios
- High loan-to-value ratios also common
- Along with limited documentation like stated or no doc
Subprime mortgage offerings are generally the same as standard loan programs, but geared toward borrowers with low credit scores, insufficient income and/or a high debt-to-income ratio that aren’t able to qualify with traditional lenders.
These types of lenders may also offer mortgage loans with high loan-to-value ratios (LTV) and limited documentation.
Or a combination of the aforementioned that make for aggressive lending practices traditional banks may deem too risky.
In essence, you can get the same exact 30-year fixed or 5/1 ARM with a subprime mortgage lender or a prime lender.
The distinguishing characteristic will be the interest rate you receive, or possibly the presence of a prepayment penalty.
Oh, and expects the mortgage points charged to be higher as well.
Many subprime critics also consider interest-only loans, negative-amortization loans, and generally any non-fixed mortgage to be subprime, although that view is somewhat extreme and more opinion than fact.
Note: Some even characterize FHA loans as subprime, seeing that the minimum credit score is 500 and the max LTV is 96.5%.
You could argue that VA loans are in the same boat because there is technically no minimum credit score, with lenders generally accepting scores well below 620.
But because such home loans are government-backed, they’re viewed as more regulated and thus safer than conventional loan offerings, whether true or not.
How Subprime Came to Be
- There were many individuals who wished to be homeowners
- But lacked the qualities necessary to qualify for a mortgage
- This created opportunity to create new, less restrictive loan programs
- That were backed by investors on the secondary market
- Fueled by the promise of never-ending home price appreciation
So how did the subprime lending industry get its start?
Well, as mortgage rates dropped and home buying became wildly popular, many prospective homeowners sought financing but were turned away from traditional banks and mortgage lenders.
This created a new, extremely large demographic that was without financing. Enter opportunity.
Proponents of subprime lending realized the demand for homeownership and mortgage refinancing despite imperfect credit.
And jumped on this untapped customer base, offering similar, if not more aggressive mortgage loan programs at a premium.
These “subprime lenders” were able to unload the mortgages to investors on the secondary market (and then onto Wall St.) quickly.
Even those with low FICO scores and limited documentation were approved, despite the obvious elevated risk of default, because of the higher investment returns associated with such securities.
The practice was justified because it allowed otherwise good borrowers with an imperfect credit history to receive home loan financing.
The theory was that it would spur the economy and increase consumer spending and employment rates.
Why Subprime Lending Worked
- The loans were often sold off by the originating lender immediately
- Then sliced and diced into mortgage-backed securities (MBS)
- And sold to investors who demanded high-yield investments
- It worked until home prices topped out and plummeted because borrowers could constantly refinance
Subprime home loan lenders and the secondary investors that backed them decided to take on more risk because of rising property values, as the risk was reduced two-fold.
First, with property values on the rise, subprime borrowers were able to gain home equity despite paying less than the fully amortized payment or interest-only payments each month because of the appreciation.
Secondly, lenders reduced their risk exposure because the rising market provided equity to the homeowners.
It was often enough collateral to refinance the loan to a lower payment option (or new teaser rate) to avoid foreclosure, or at the very least, sell the property for a small profit.
So the loans often didn’t last very long before they were prepaid, but the commission earned on the loans was pocketed. Then the process was repeated.
Unfortunately, this formula was clearly flawed, and once home price gains slowed and eventually dropped, a flood of mortgage defaults and foreclosures hit the market.
Before long, most of the investors backed out, leaving subprime lenders with no capital and a lot of closed doors.
Subprime lending was never short of critics. Many felt it was merely a form of predatory lending, offering risky mortgage programs at unreasonable costs.
The result was often pushing under-qualified borrowers into poorly explained loan programs such as option-arms and interest-only home loans, leaving them with mountains of insurmountable debt.
These borrowers, who were essentially destined to fail, then had few options to avoid foreclosure once the low payment options ran dry.
In late 2006 and early 2007, many of the largest subprime lenders closed shop, including Fremont, New Century, Ameriquest, and many, many more. Too many to list to be honest.
Others, like Countrywide and Indymac, offered subprime loans alongside other seemingly less risky offerings, and eventually shuttered as well.
I’d add a list of subprime mortgage lenders, but there aren’t any left…here is a general list of closed lenders, many of them subprime.
Where to Get a Subprime Mortgage Today
- You could argue that many government home loans are subprime
- Since FHA, VA, and USDA loans all allow credit scores in the 500s
- Which is well below the traditional 620 FICO score cutoff and certainly poor credit
- There’s also a new breed of quasi-subprime known as non-QM
Nowadays, if you’re looking for a subprime loan, you can either check out government programs like FHA loans or VA loans, or seek out a non-QM lender, the latter of which offers more accommodating financing alternatives.
As noted, both the FHA and VA allow subprime borrowers to apply because they accept credit scores well below 620.
You can also look into non-QM lenders, newcomers to the mortgage market that don’t adhere to the Qualified Mortgage (QM) rule.
While not necessarily geared toward those with subprime credit, and such lenders will probably dislike any association, non-QM lending does seem to be the most similar in terms of flexibility.
For example, many of these lenders offer stated income, interest-only, asset-based qualification, recent negative credit events, and so on.
In exchange, borrowers are given high rate loans, or least higher than prime offerings, but probably wouldn’t be able to get financing otherwise.
Over time, it’ll be interesting to see delinquency rates on this new breed of home loans.
